Below we compare CHUNKFIT fits performed on the SED of NGC7469
to CHUNKFIT fits performed on substantially noisier versions of the same spectrum.
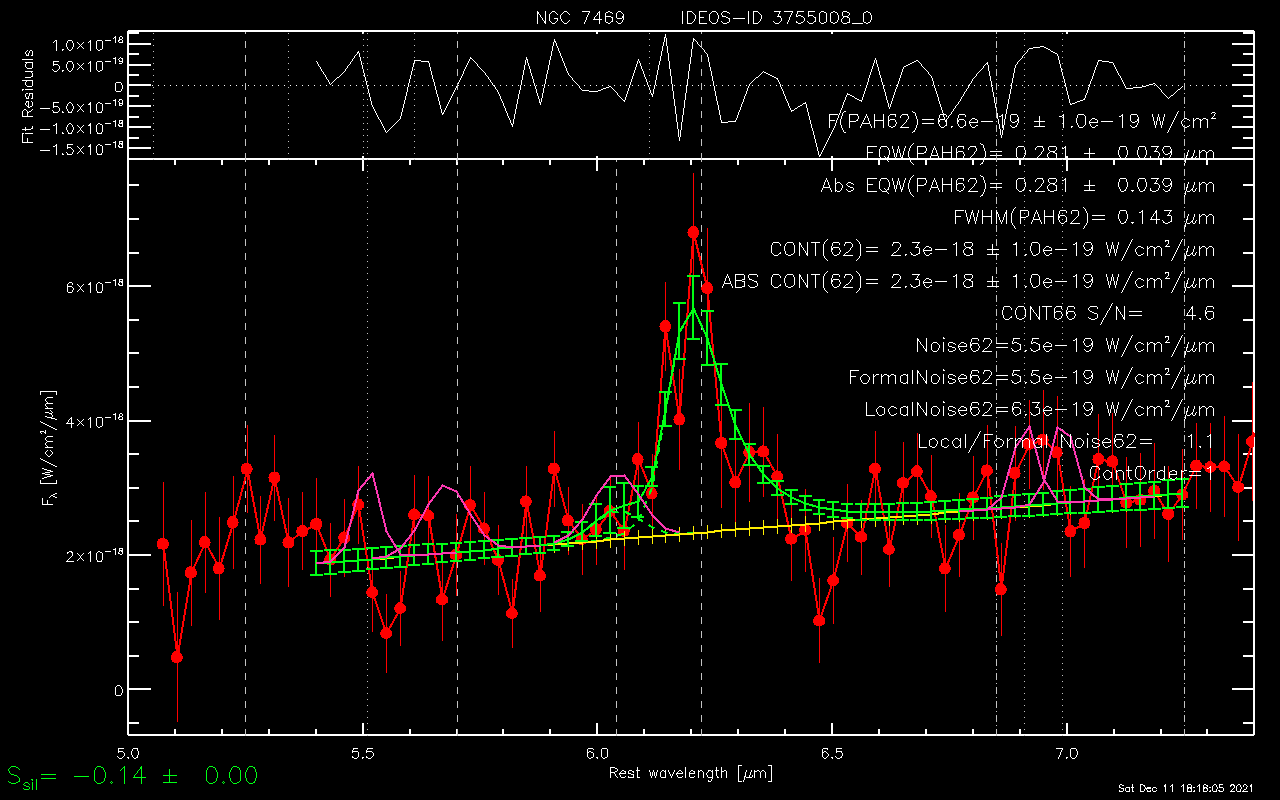
5.39-7.25µm range
This is a fit to the real SED.
We have increased the noise by a factor 22. This results in CHUNKFIT to
adopt a 1st instead of 3rd order polynomial to fit the continuum. All
but the broad and strong PAH62 feature is detected.
Another random copy of the SED at the same factor 22 higher
noise. The PAH62 flux is clearly different in each of the copies:
6.6E-19 versus 5.4E-19 versus 4.4E-19. Compare this to the
measurement in the real SED: 6.2E-19 W/cm2.
Yet another random copy of the SED at the same factor 22 higher noise. In this
version the [Ar II] feature rises above the noise. CHUNKFIT deems the feature
detected.
We have increased the noise by a factor 44 compared to the real
SED. CHUNKFIT notices that the PAH62 feature appears blue shifted by so much
that it raises a concern: it suggests to check the redshift of the source.
8.7-10.3µm range
This is a fit to the real SED.
We have increased the noise by a factor 30 compared to the real
SED. This results in CHUNKFIT to adopt a 2nd instead of 6th order
polynomial to fit the continuum. All emission features are deemed
upper limits by CHUNKFIT.
9.8-13.5µm range
This is a fit to the real SED.
Here we have forced the PAH107 feature to be fitted, as it
improves the fit in the 10.1-10.85 micron range. A consequence is a
small change in the slope of the continuum, which causes a 7% change
in the PAH112 flux. This is the fit used in IDEOS.
We have increased the noise by a factor 30. All but the broadest
and strongest features are no longer detected.
Another factor two increase in the noise results in CHUNKFIT to
adopt a 2nd instead of 4th order polynomial to fit the continuum.
13.0-15.4µm range
This is a fit to the real SED.
We have increased the noise by a factor 25. Neither PAH feature
is deemed detected. The S/N(14µm) of the spectrum is just
above 13. Below S/N=13 CHUNKFIT would have lowered the order of
the polynomial continuum from 4 to 2. This would have avoided the
wobbly continuum shape, but would not have resulted in a detection of
the PAH142 and [Ne V] line.
14.5-21.0µm range
This is a fit to the real SED.
We have increased the noise by a factor 28. Apart from the
strongest emission lines [Ne III] and [S III] all other spectral
features have become upper limits. The presence of the broad 17µm PAH
plateau makes the shape of the underlying continuum less well defined.
We have increased the noise by a factor 56. Even the broad PAH
plateau has been swallowed by the noise. The 15µm continuum has not
changed by more than 5% in the process.
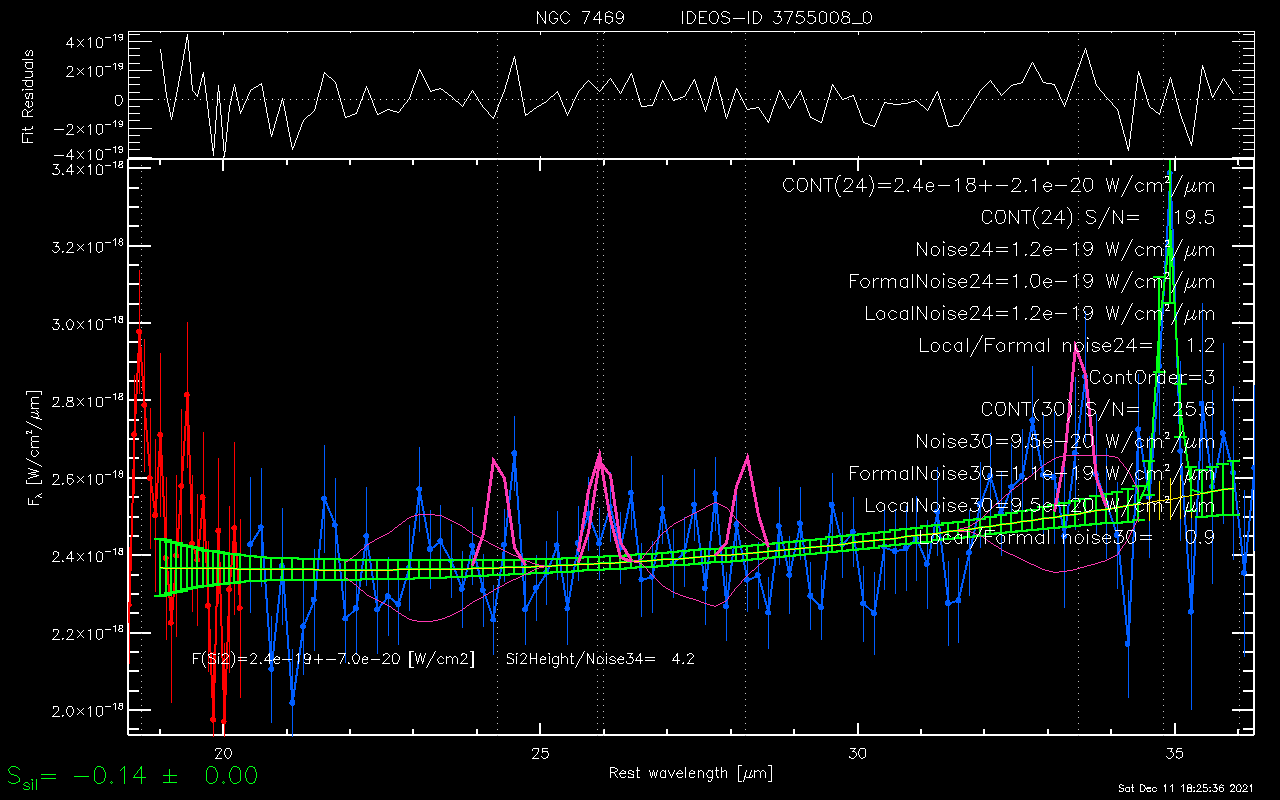
19-36.5µm range
This is a fit to the real SED.
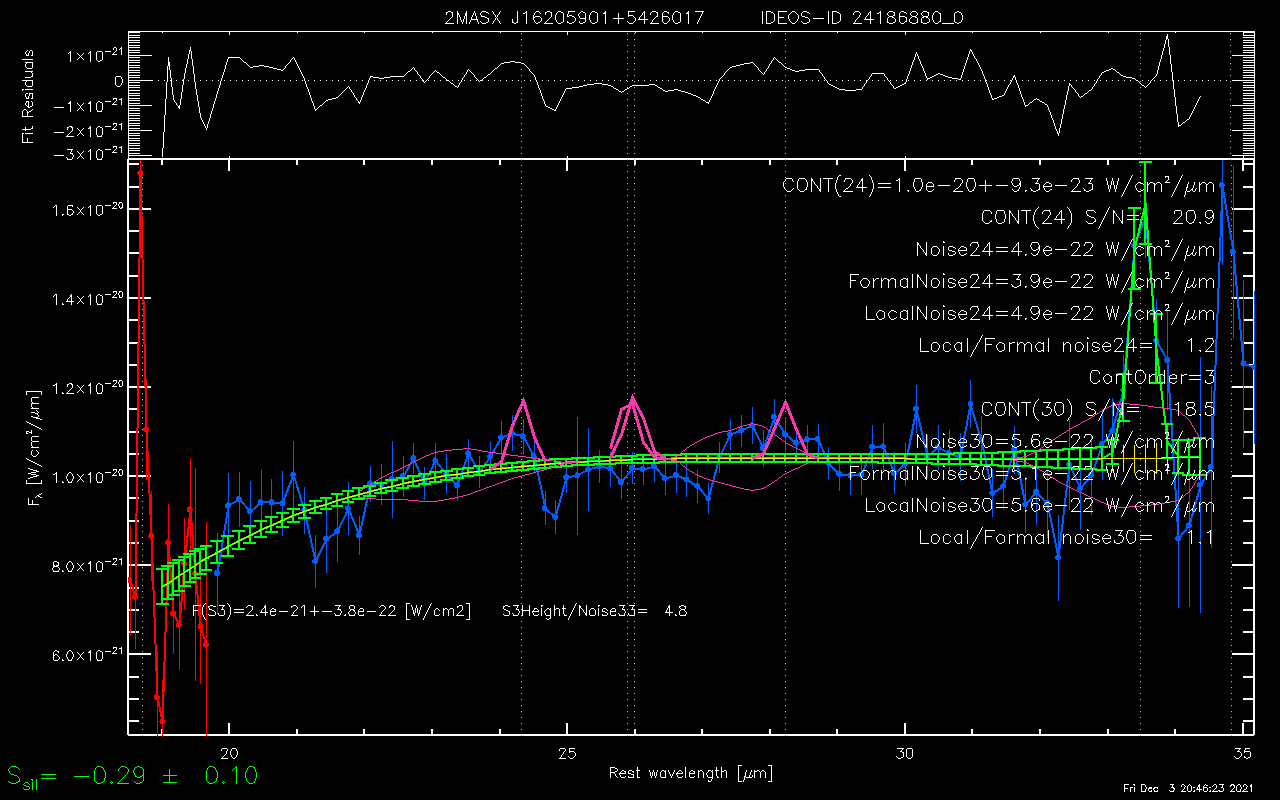
We have increased the noise by a factor 32. Apart from the
strongest
and most isolated feature, the [Si II] line, all spectral features
have disappeared in the noise.
Water ice feature yes or no?
In this fit the excess emission centered at 6.7µm is ignored by
CHUNKFIT. We regard this as a tell-tale sign of a 6.85µm hydrocarbon
absorption feature. The equivalent width of PAH62 is 0.66µm in this
fit.
In this fit to the same spectrum we forced CHUNKFIT to fit a
water ice and hydrocarbon
feature. The upturn centered at 6.7µm is now fitted as part of the
blue wing of the hydrocarbon feature. The H2 S(5) line is now
reported as detected within the hydrocarbon feature. Notice that
the continuum is no longer concave. We regard this as a tell-tale
signature for the need to fit a water ice feature.
The ice-corrected equivalent width of the PAH62 feature decreases
to 0.60µm. The ice-absorbed equivalent width is 0.76µm.
Incentivized fit to a water ice feature
In this fit the spectral structure from 6.6-6.9µm is again
ignored by CHUNKFIT. And the continuum slopes down far too
strongly around 6 microns. This suggest the presence of a
water ice feature.
In this fit to the same spectrum we forced CHUNKFIT to fit a
water ice and hydrocarbon feature. This is not enough to make
CHUNKFIT go bold.
By forcing the ice-corrected continuum to be linear a much
stronger ice feature is suggested, more in line with the actual slope
of the continuum at shorter wavelengths. Note the presence of a
5.61µm [Mg V] line, which is ignored by CHUNKFIT. Coronal lines
from Mg ions only occur in highly excited AGN spectra of which
there are not too many.
Continuum less well-defined towards extremes
Bad luck at the blue end of this CHUNKFIT range: the continuum
follows the curvature as instructed. A lower order of the polynomial
continuum would have avoided CHUNKFIT going down this rabbit hole.
Entering this galaxy in the CHUNKFIT override table is all that is
needed to force the lower order to be adopted.
It looks like a feature, it smells like a feature, but it is not real
The optimal fit for this chunk includes a fit of the 23µm
forsterite feature. Looking at the surrounding spectral structure
with many unaccounted-for similar broadish 'features' made us
override this feature. Below is the spectrum as adopted in IDEOS.
After forcing an upper limit for the 23 micron forsterite
feature. This is the version used in IDEOS.