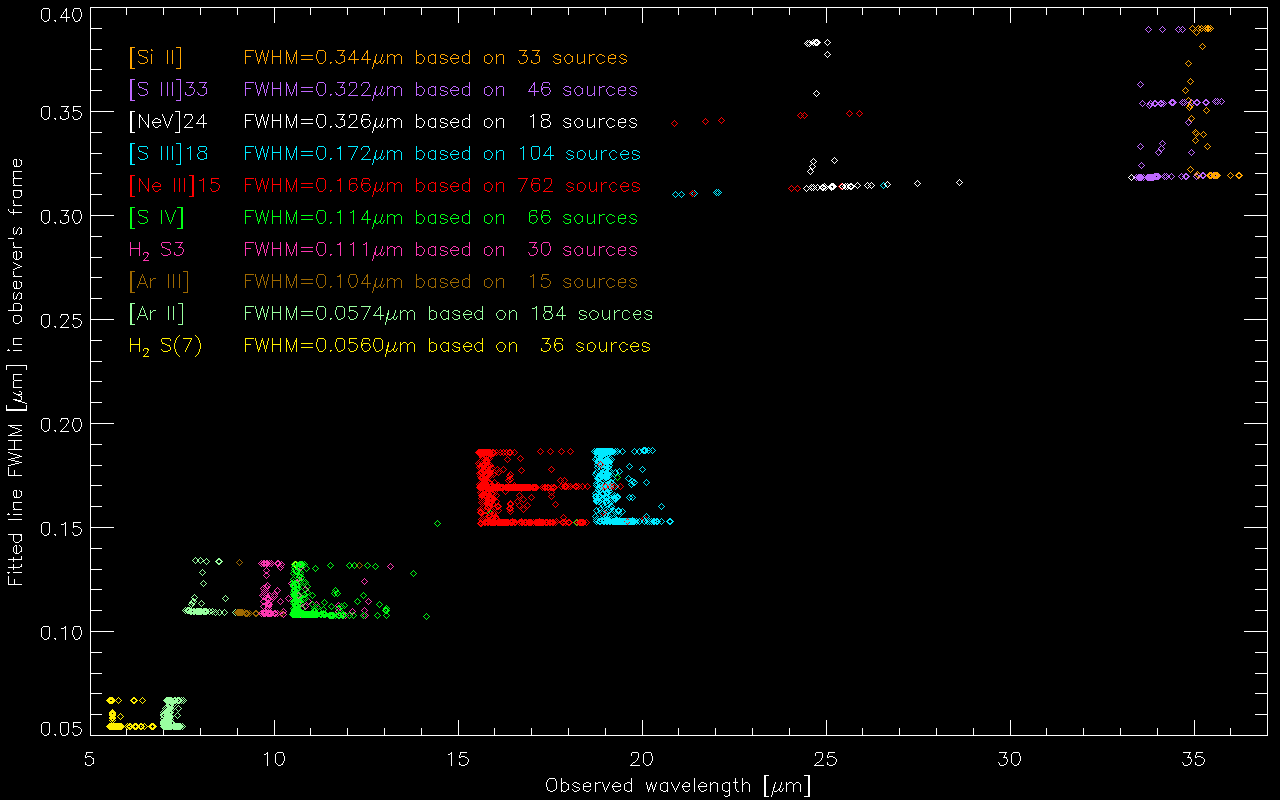
We have analyzed the line widths of emission lines observed in the
SL and LL modules as fitted by CHUNKFIT. CHUNFIT allows line widths
to vary by 10% above and below our adopted line widths.
In the plot below we show the fitted line widths for
all emission lines detected at 10 sigma or more. Not included are
severely blended lines such as [NeV]14µm and [OIV]26µm. For the
[ArII] line we excluded sources that have a detection of the
H2 S(5) line that [Ar II] line is (partially) blended with.
For the [S III]33µm and [Si II] lines we excluded sources with
strong detections for the broad 33µm forsterite feature:
|S_cryst(33µm)|>0.04.
We computed average line widths for each of the lines based on
the portion of observations plotted from sources at redshifts <0.02.
The results are plotted on the plot below. These results validate the
spectral resolution table as shown in Table 2 of Spoon et al. (2022).